

Modern System-on-Chips (SoCs) ship with a growing population of embedded instruments, including CPU debug units, on-chip trace IP, performance counters, logic analysers, BIST (built-in self-test) engines and sensors. These instruments are invaluable during emulation, bring-up and silicon debug, but they are often buried deep inside the device. Historically, access depended on proprietary scan structures and chip-specific scripts, forcing tool vendors and engineering teams to understand each device implementation in detail. IEEE 1687, commonly known as IJTAG, was introduced to address this access problem.
IJTAG defines a standard, reconfigurable scan network that is commonly accessed through an IEEE 1149.1 TAP (Test Access Port). The network is built from Test Data Registers (TDRs) and Segment Insertion Bits (SIBs). A SIB acts as a gate, either bypassing or inserting a sub segment of the scan chain. Bypassing unused segments shortens the effective scan chain, improving access performance, while insertion selectively includes only the instruments needed. Crucially, the standard introduces two machine readable description languages: ICL (Instrument Connectivity Language), which describes the on-chip network topology, and PDL (Procedural Description Language), which describes the operations available on each instrument. A debugger that understands ICL and PDL can use these descriptions to reach and operate compliant instruments without requiring a bespoke driver for every chip specific scan path.
ICL and PDL originate from the chip design flow itself. Instrument IP can ship with its own descriptions, and EDA (Electronic Design Automation) DFT (Design for Test) tools can “stitch” these into a top level ICL description of the assembled on-chip network. For the debugger, this turns IJTAG from a raw scan mechanism into a structured access model that reflects the actual instruments integrated into the SoC, as shown in Figure 1.
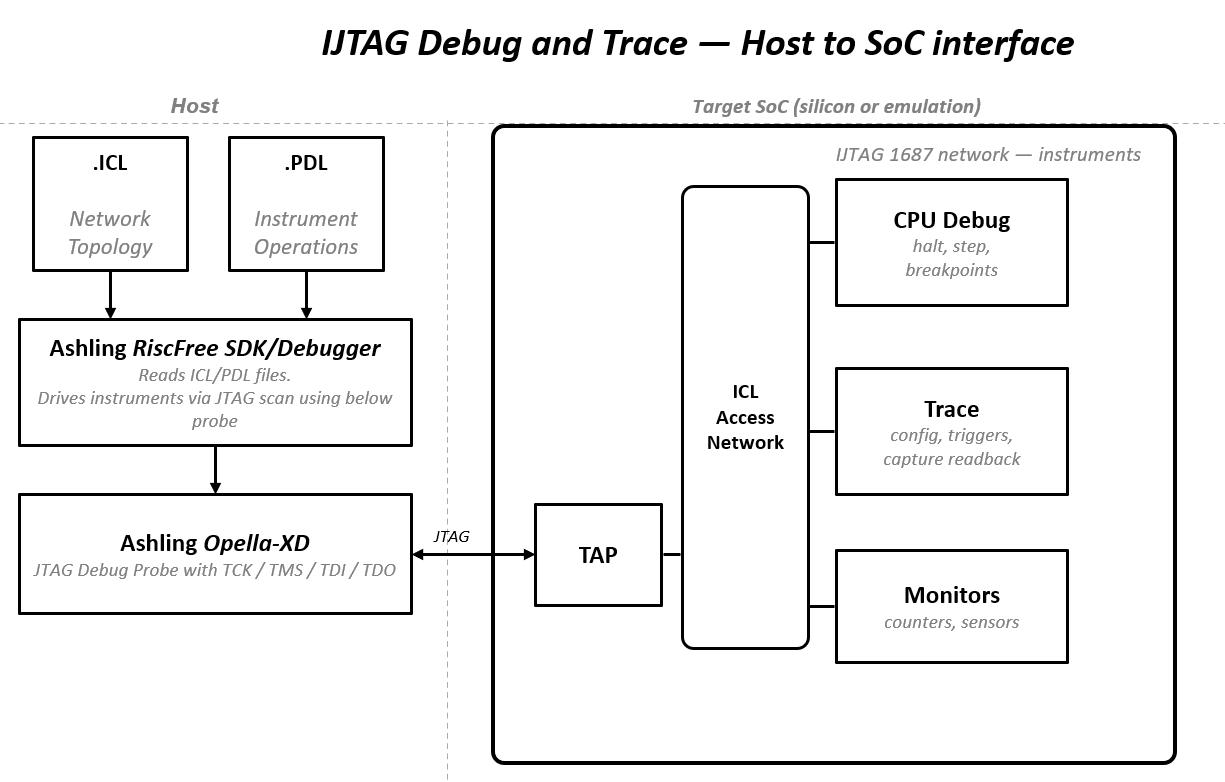
Figure 1: Ashling’s RiscFree and Opella-XD connecting to IJTAG instruments inside a SoC
The real power of IJTAG is what it puts in the hands of the engineer. Instruments such as memory and logic BIST, on chip trace, performance counters, cross triggers, power and thermal sensors, and custom debug logic have often sat behind proprietary or DFT focused access mechanisms. That can make them difficult to use during emulation, bring up and field debug, precisely when visibility is most valuable. IJTAG changes this by describing the access network in ICL and the instrument operations in PDL. Ashling’s host-based, RiscFree debugger can use those descriptions to reach and exercise the instruments exposed by the SoC team, uniformly, through the same JTAG access path already used for debug and test. JTAG over TCP/IP is also possible in emulation environments. The result is a more joined up debug experience: software debug and silicon visibility available from the same RiscFree environment.
Tenstorrent designs and licenses RISC-V CPU IPs. Its first-generation licensable CPU IP, Ascalon™ X, is a cluster of 8 RVA23-compliant, Out-of-Order, high-performance (>21 SPECint2006 / GHz) Cores with shared L2 cache, Coherent (CHI) & Non-Coherent (AXI) interfaces, power management, interrupt, trace & debug blocks. The trace and debug blocks are accessible from a JTAG TAP via an IJTAG-compliant hierarchical network.
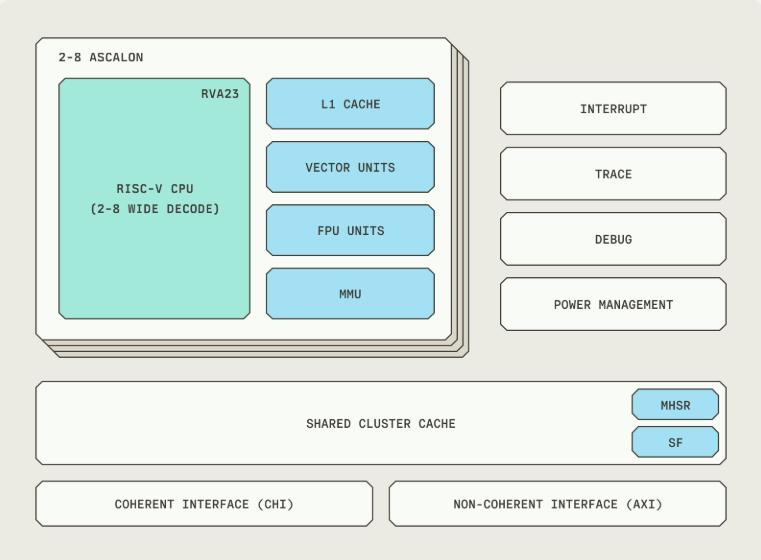
Figure 2a: Tenstorrent Ascalon RISC-V CPU IP
The Ascalon™ Cluster will be available in the upcoming Atlantis SoC, offering a platform for RISC-V software and application developers. The emulation platform was used to ensure software debug readiness prior to silicon. On emulation platforms, Ashling’s RiscFree debugger validated Ascalon’s debug and trace features over the TAP via the IJTAG hierarchy.
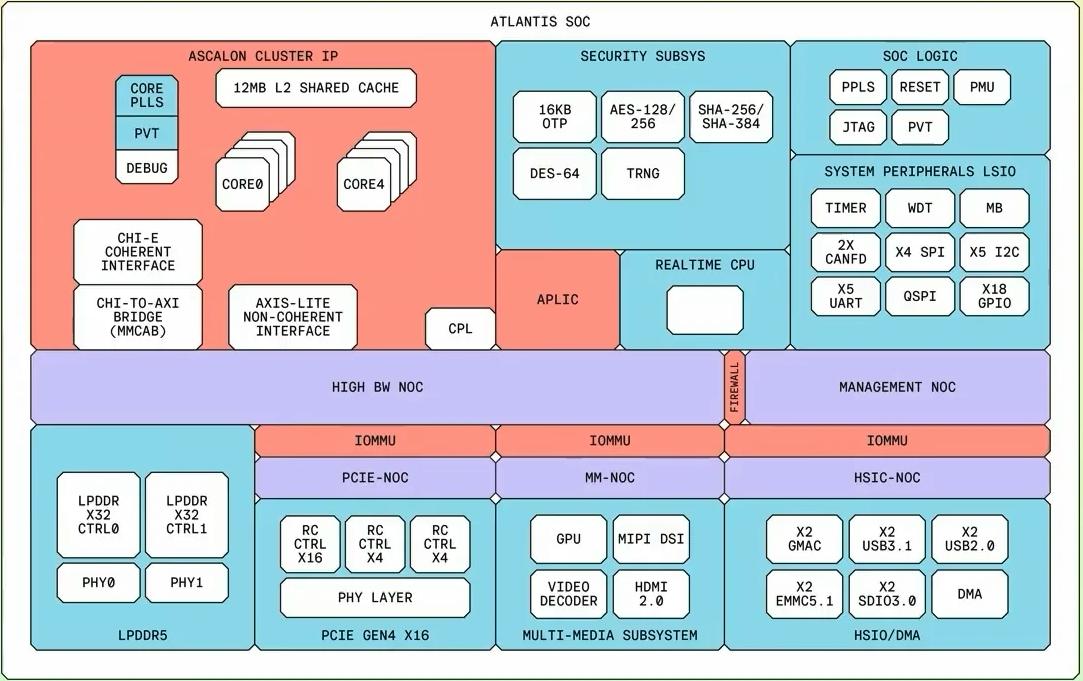
Figure 2b: Ascalon powered Atlantis SoC
Ashling’s RiscFree debugger reads the design’s ICL and PDL files and uses IJTAG to reach embedded CPUs and instruments inside the emulated SoC. Because the IJTAG network is described directly, RiscFree can identify the available access paths and invoke the relevant PDL procedures through the SoC hierarchy. In the Ascalon example, the exposed instruments include the RISC-V CPU JTAG TAP, trace configuration and capture logic, and power monitors. If a RISC-V CPU crashes, the IJTAG interface can remain accessible, allowing trace data to be read out over IJTAG rather than through the RISC-V Debug Module JTAG path, helping the engineer determine the root cause, as shown in Figure 3.
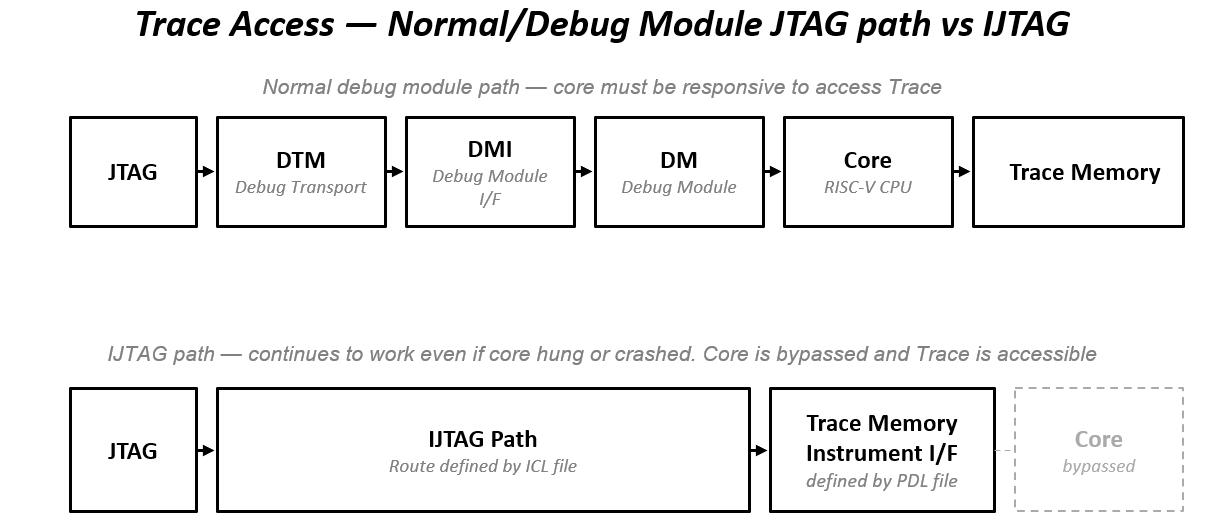
Figure 3: Trace access through IJTAG when the standard RISC-V debug path is unavailable
From the engineer’s desk, the experience is debug, expanded. The familiar capabilities remain: set a breakpoint, halt a core, inspect registers, read memory and configure a trace session. Sitting alongside these are the instruments the chip designer has exposed through IJTAG, ready to be configured, triggered or read back from the same RiscFree environment. Opella-XD provides the physical debug connection and drives access through the emulator’s JTAG bridge. The same RiscFree workflow can then carry forward when first silicon arrives, helping to shorten bring up and reduce the gap between emulation and silicon debug.
For SoC teams, the practical payoff is consistency: one debugger, one description format and one access mechanism across simulation, emulation and silicon, and across the growing variety of cores and instruments inside a heterogeneous chip.
As SoCs grow more heterogeneous and chiplet-based architectures become more common, the count and variety of embedded instruments will only increase, and the access problem will get harder, not easier. IJTAG is the standard designed to scale with that complexity, and a debugger that understands ICL and PDL is becoming an essential part of modern SoC bring up and debug. Ashling has built exactly that kind of tooling for the embedded industry. Together, Ashling’s RiscFree and Opella-XD give SoC teams a practical, product-based path for carrying debug and trace workflows from emulation through to silicon.
Questions? We’d love to hear from you and please send your questions or comments to: engineer@ashling.com