
October, 2021 – Limerick, Ireland.
It’s 3:00am and you’re at home sleeping peacefully. Your code, however, is not—it’s running hard in the office (remember the office?) where it is being poked, stretched, and strained by “Jenkins” your trusty test server. 459 tests have all passed so far and number 460 is in progress when suddenly … bam … crash … and your code comes to a shuddering halt. Jenkins nods, takes a snapshot, cleans up the mess and sends you a “breakfast” email with the bad news.
The next day you load the core dump snapshot file into RiscFree™ and immediately see the state of your program at the time of that 3:00am crash. The corresponding memory areas, registers, PC, high-level call stack, and variable values are all clearly visible and interrogatable within RiscFree™. Within seconds, you’ve traced the problem to malformed data causing an invalid index access into a buffer, resulting in a variable overwrite. After checking in a fix, you rebuild and rerun test 460 to confirm the issue is resolved.
“That was easy,” you think. The Core Dump snapshot allowed recording of the system state exactly when the test failed, and RiscFree™ subsequently allowed me to load the snapshot and pinpoint the cause of the error in my program. Job done and time for the first brew of the day … now where is Jenkins gone?

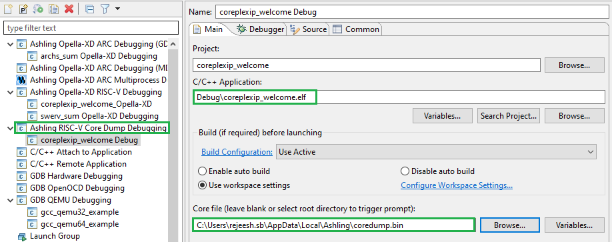

RiscFree™ allows detailed analysis of a captured Core Dump file. Thank you, Jenkins!
RiscFree™ IDE, Ashling’s professional, commercial-grade software development environment, includes support for embedded 32-bit and 64-bit Arm and RISC-V based devices. The Eclipse-based IDE provides a seamless environment for development—from writing and building code to simulating and hardware debugging. RiscFree™ IDE has heterogeneous multicore debug capabilities and can be used with Ashling’s Opella-XD hardware debug probe and OpenOCD-compatible probes.
Hugh O’Keeffe, VP Global Engineering
Email: hugh.okeeffe@ashling.com
All trademarks, logos, and brand names are the property of their respective owners.